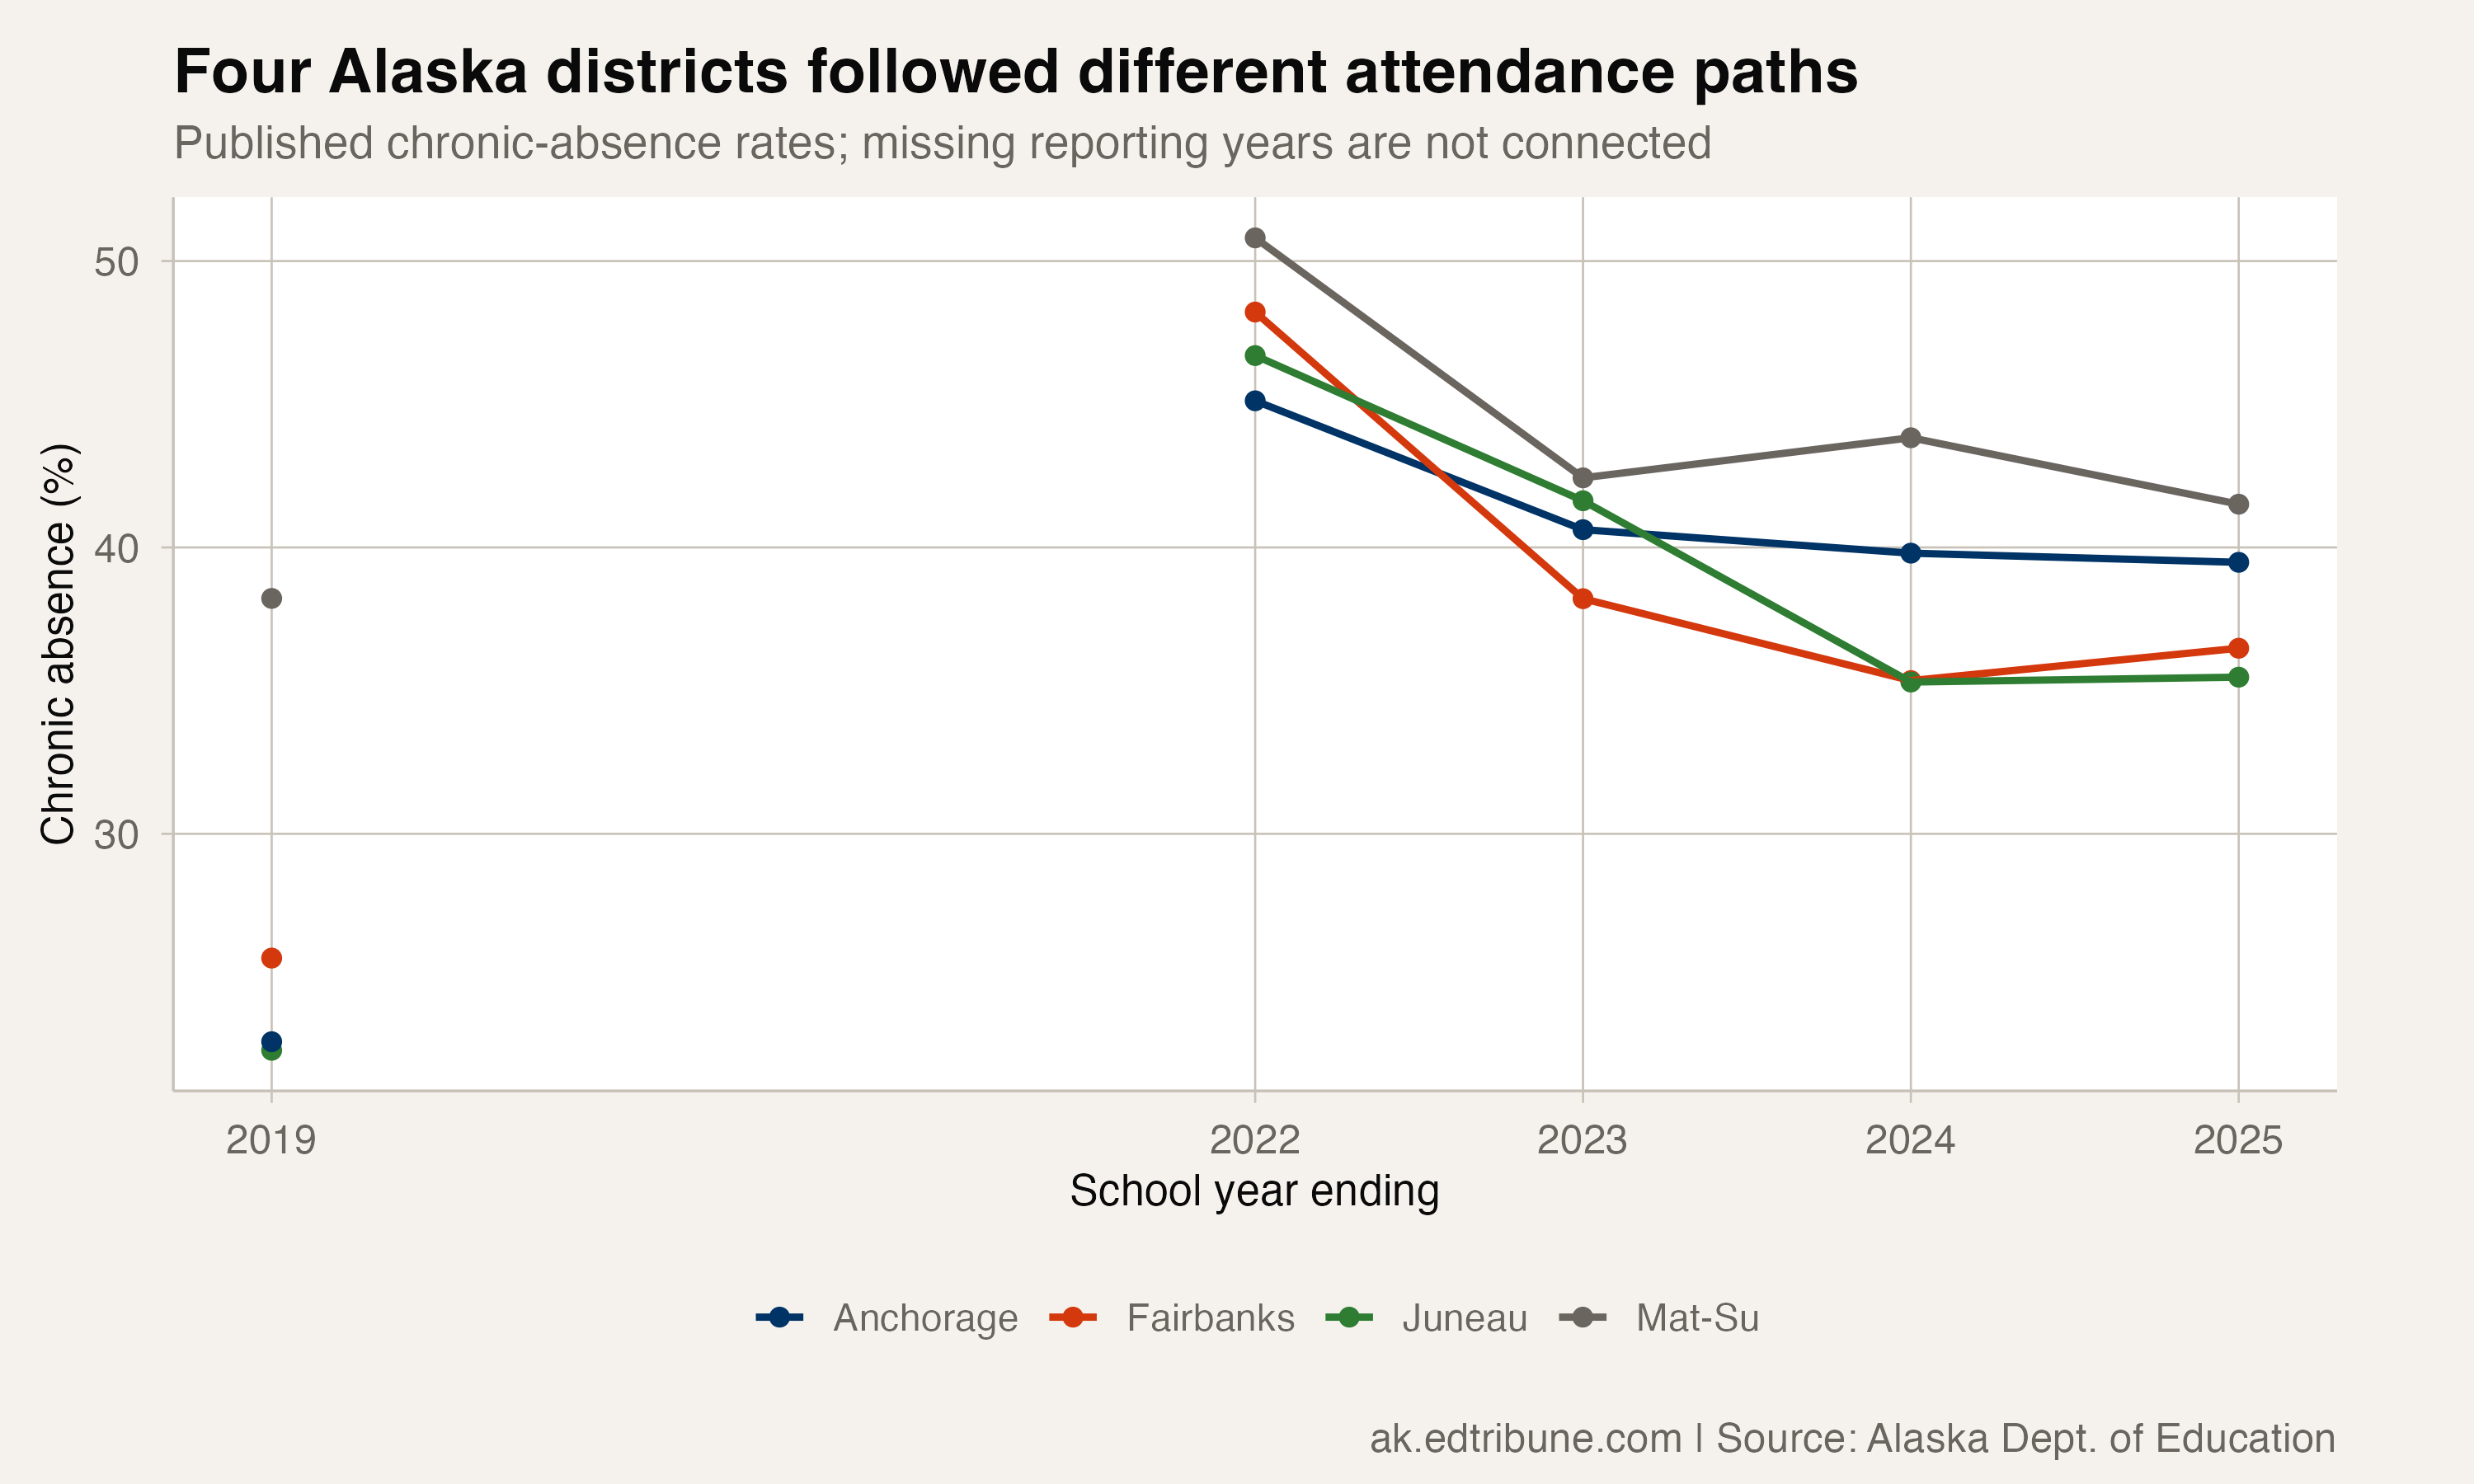
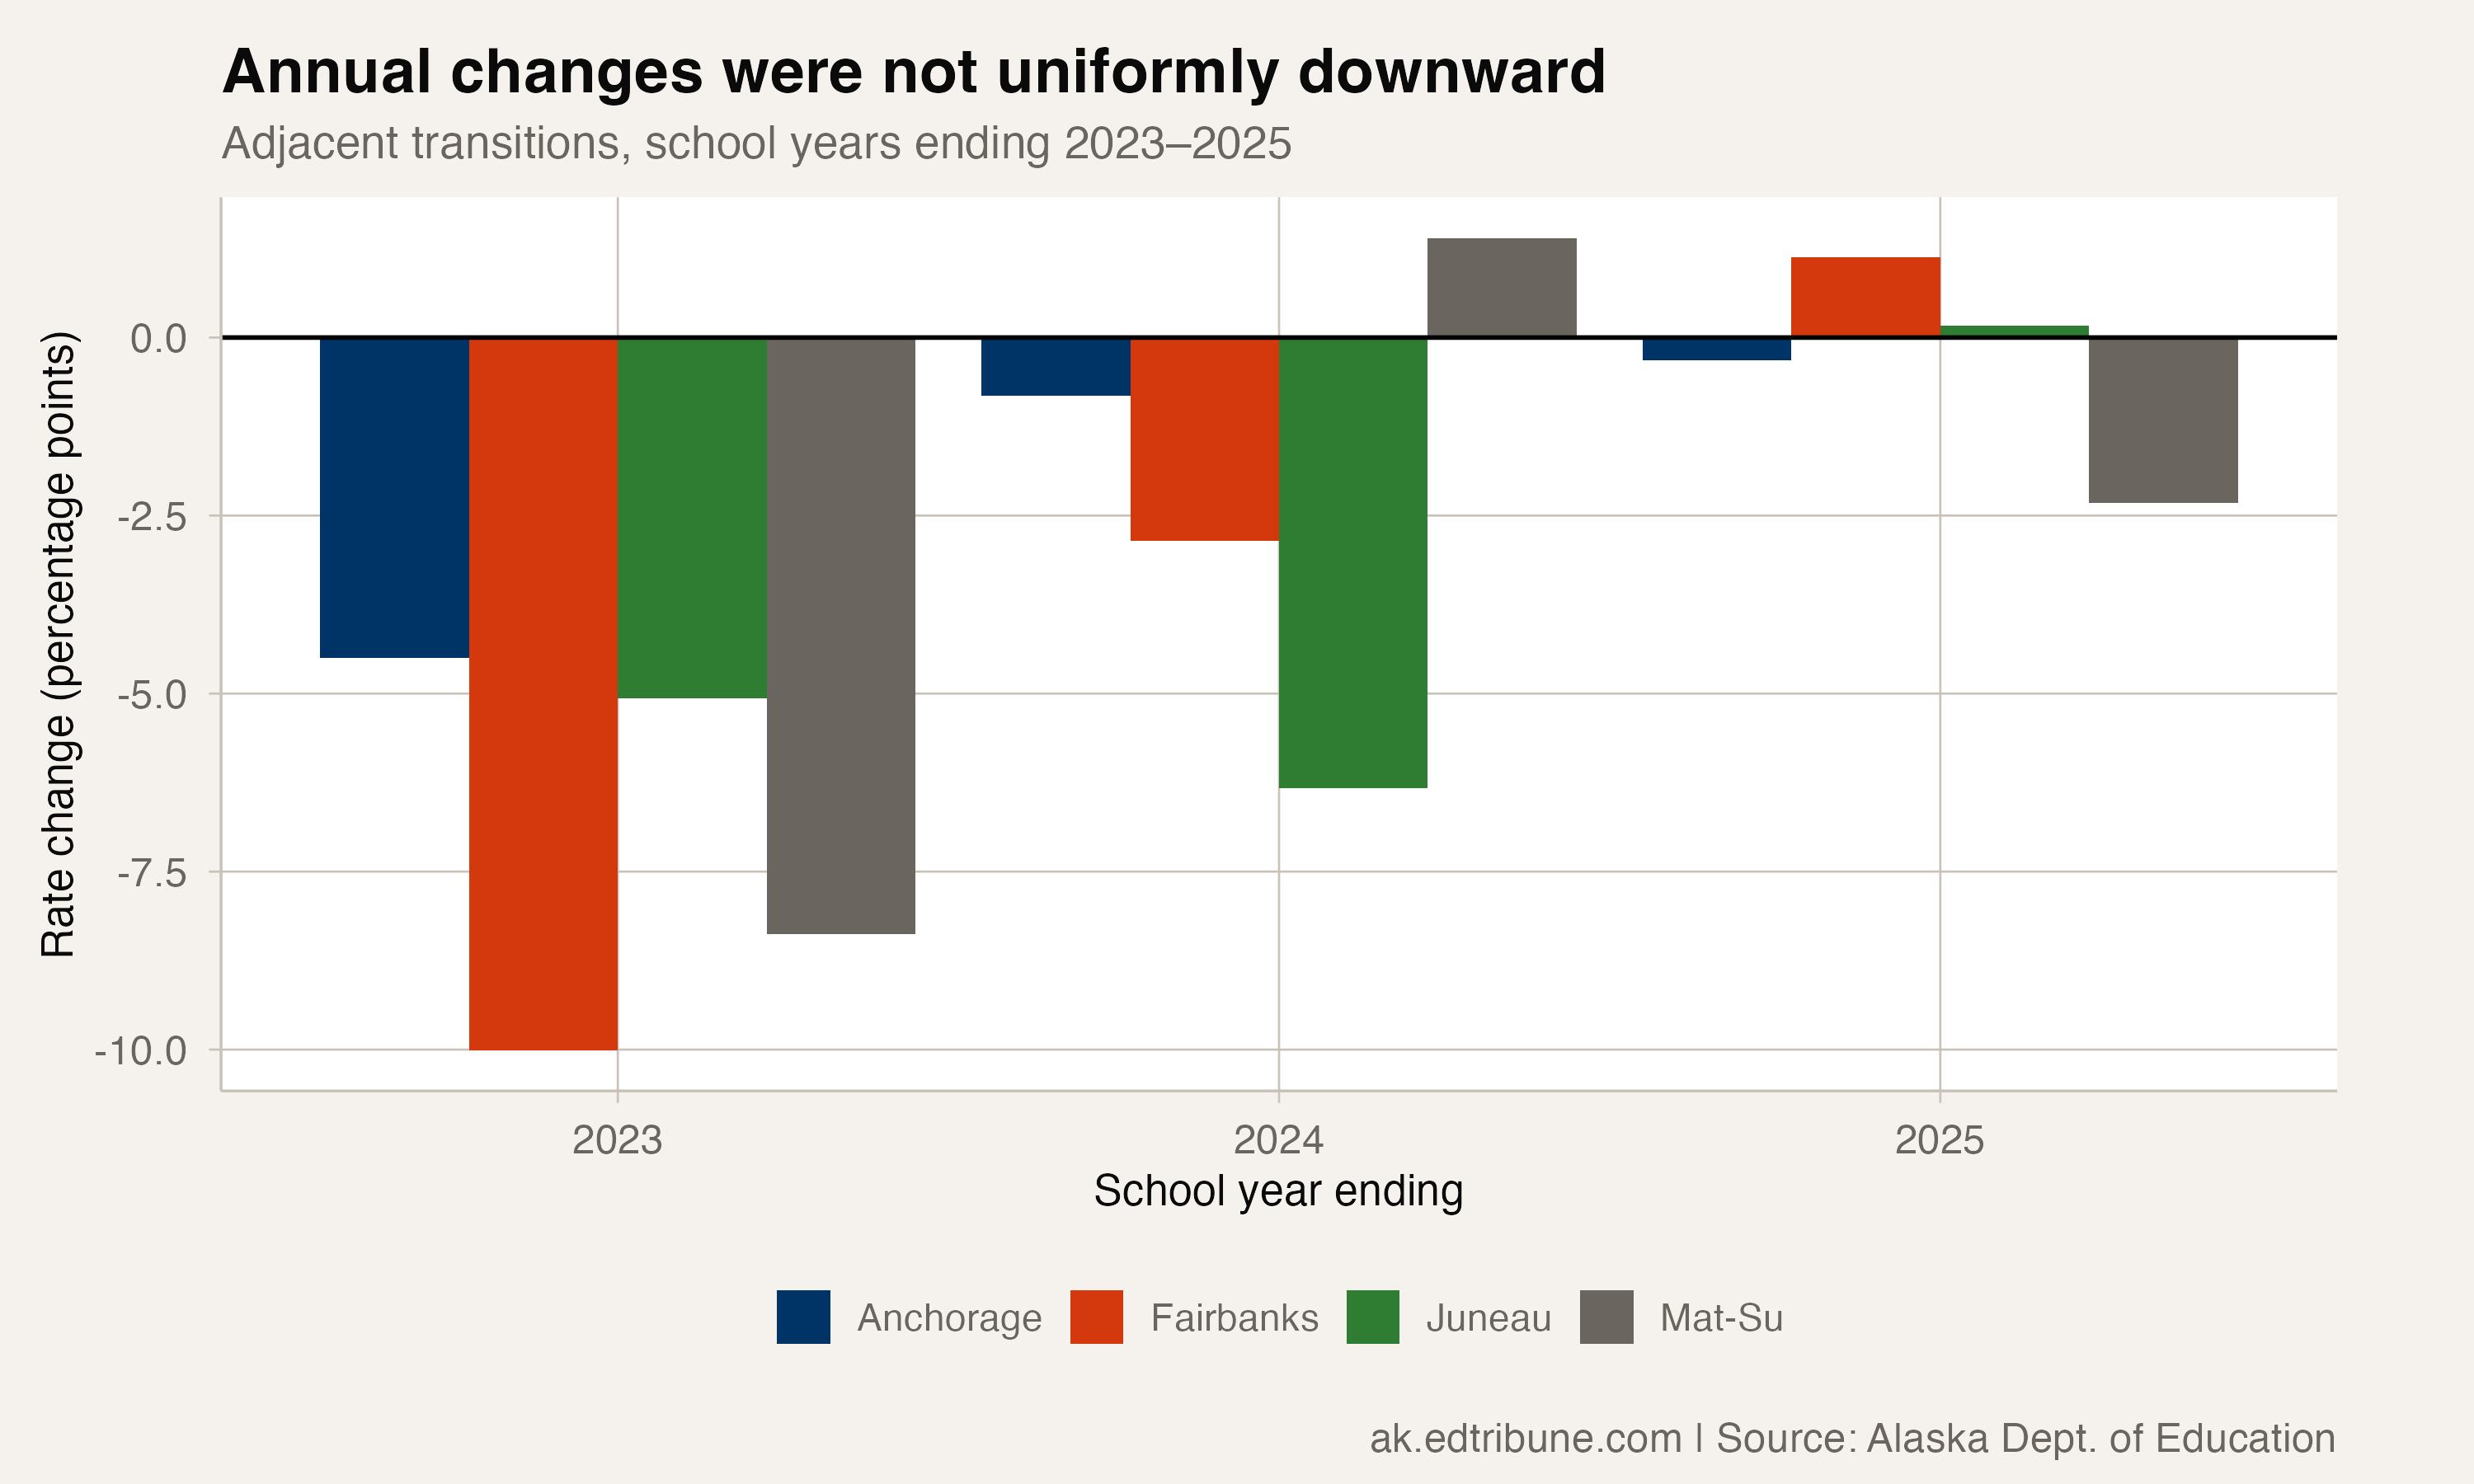
Anchorage School District↗ET and Matanuska-Susitna Borough School District↗ET reported lower chronic-absence rates in 2024-25 than a year earlier. Fairbanks North Star Borough School District↗ET and Juneau Borough School District↗ET moved in the other direction. The four selected districts had all improved from their 2021-22 rates, but their latest annual changes did not follow one common path.
Juneau's published rate was 35.5% in 2024-25, compared with 36.5% in Fairbanks, 39.5% in Anchorage and 41.5% in Mat-Su. Alaska's statewide rate was 42.8%. These are historical reporting figures, rather than counts or rates for the current school year.
Earlier gains did not guarantee another decline
Juneau went from 46.7% in 2021-22 to 35.3% in 2023-24. Its rate then edged up to 35.5% in 2024-25, an increase of 0.2 percentage points. That small reversal matters when describing the path: Juneau was still 11.2 points below its 2021-22 rate, but the latest year was not another annual improvement. Its 2024-25 rate remained 7.4 points below the state.
Fairbanks followed a similar recent turn. Its rate fell from 48.2% in 2021-22 to 38.2% in 2022-23 and 35.4% in 2023-24. The next published rate, 36.5%, was 1.1 points higher. The endpoint was well below the earlier high even though the most recent transition went upward.
These observations describe different reported student populations in each year. They cannot show whether the same students changed their attendance, and they do not identify an intervention responsible for either district's gains or reversals.
Anchorage and Mat-Su ended with improvement
Anchorage's rate went from 45.1% in 2021-22 to 40.6% in 2022-23, then to 39.8% and 39.5%. Across those last two annual transitions, the decline totaled 1.1 points. That is a slower improvement than the first post-2021-22 decline, while still being measurable progress.
Mat-Su's path was less steady. It reported 50.8% in 2021-22 and 42.4% in 2022-23, followed by an increase to 43.8% in 2023-24. Its 2024-25 rate of 41.5% restored a downward direction. Calling all of that an uninterrupted recovery would omit the intervening increase.
The older baseline also changes how the endpoints look. In 2018-19, Anchorage reported 22.7%, Fairbanks 25.7%, Juneau 22.4% and Mat-Su 38.2%. All four 2024-25 rates were above those earlier observations. Missing reporting years between that baseline and the post-pandemic period are shown as a gap, not connected as a measured annual trend.
Subgroup rates describe separate experiences
The 2024-25 statewide comparison does not replace the rates published for individual student groups. Juneau's published rate for White students was 28.8%, while Mat-Su's was 39.4%. For Alaska Native and Native American students, Juneau reported 43.8% and Fairbanks 54.4%.
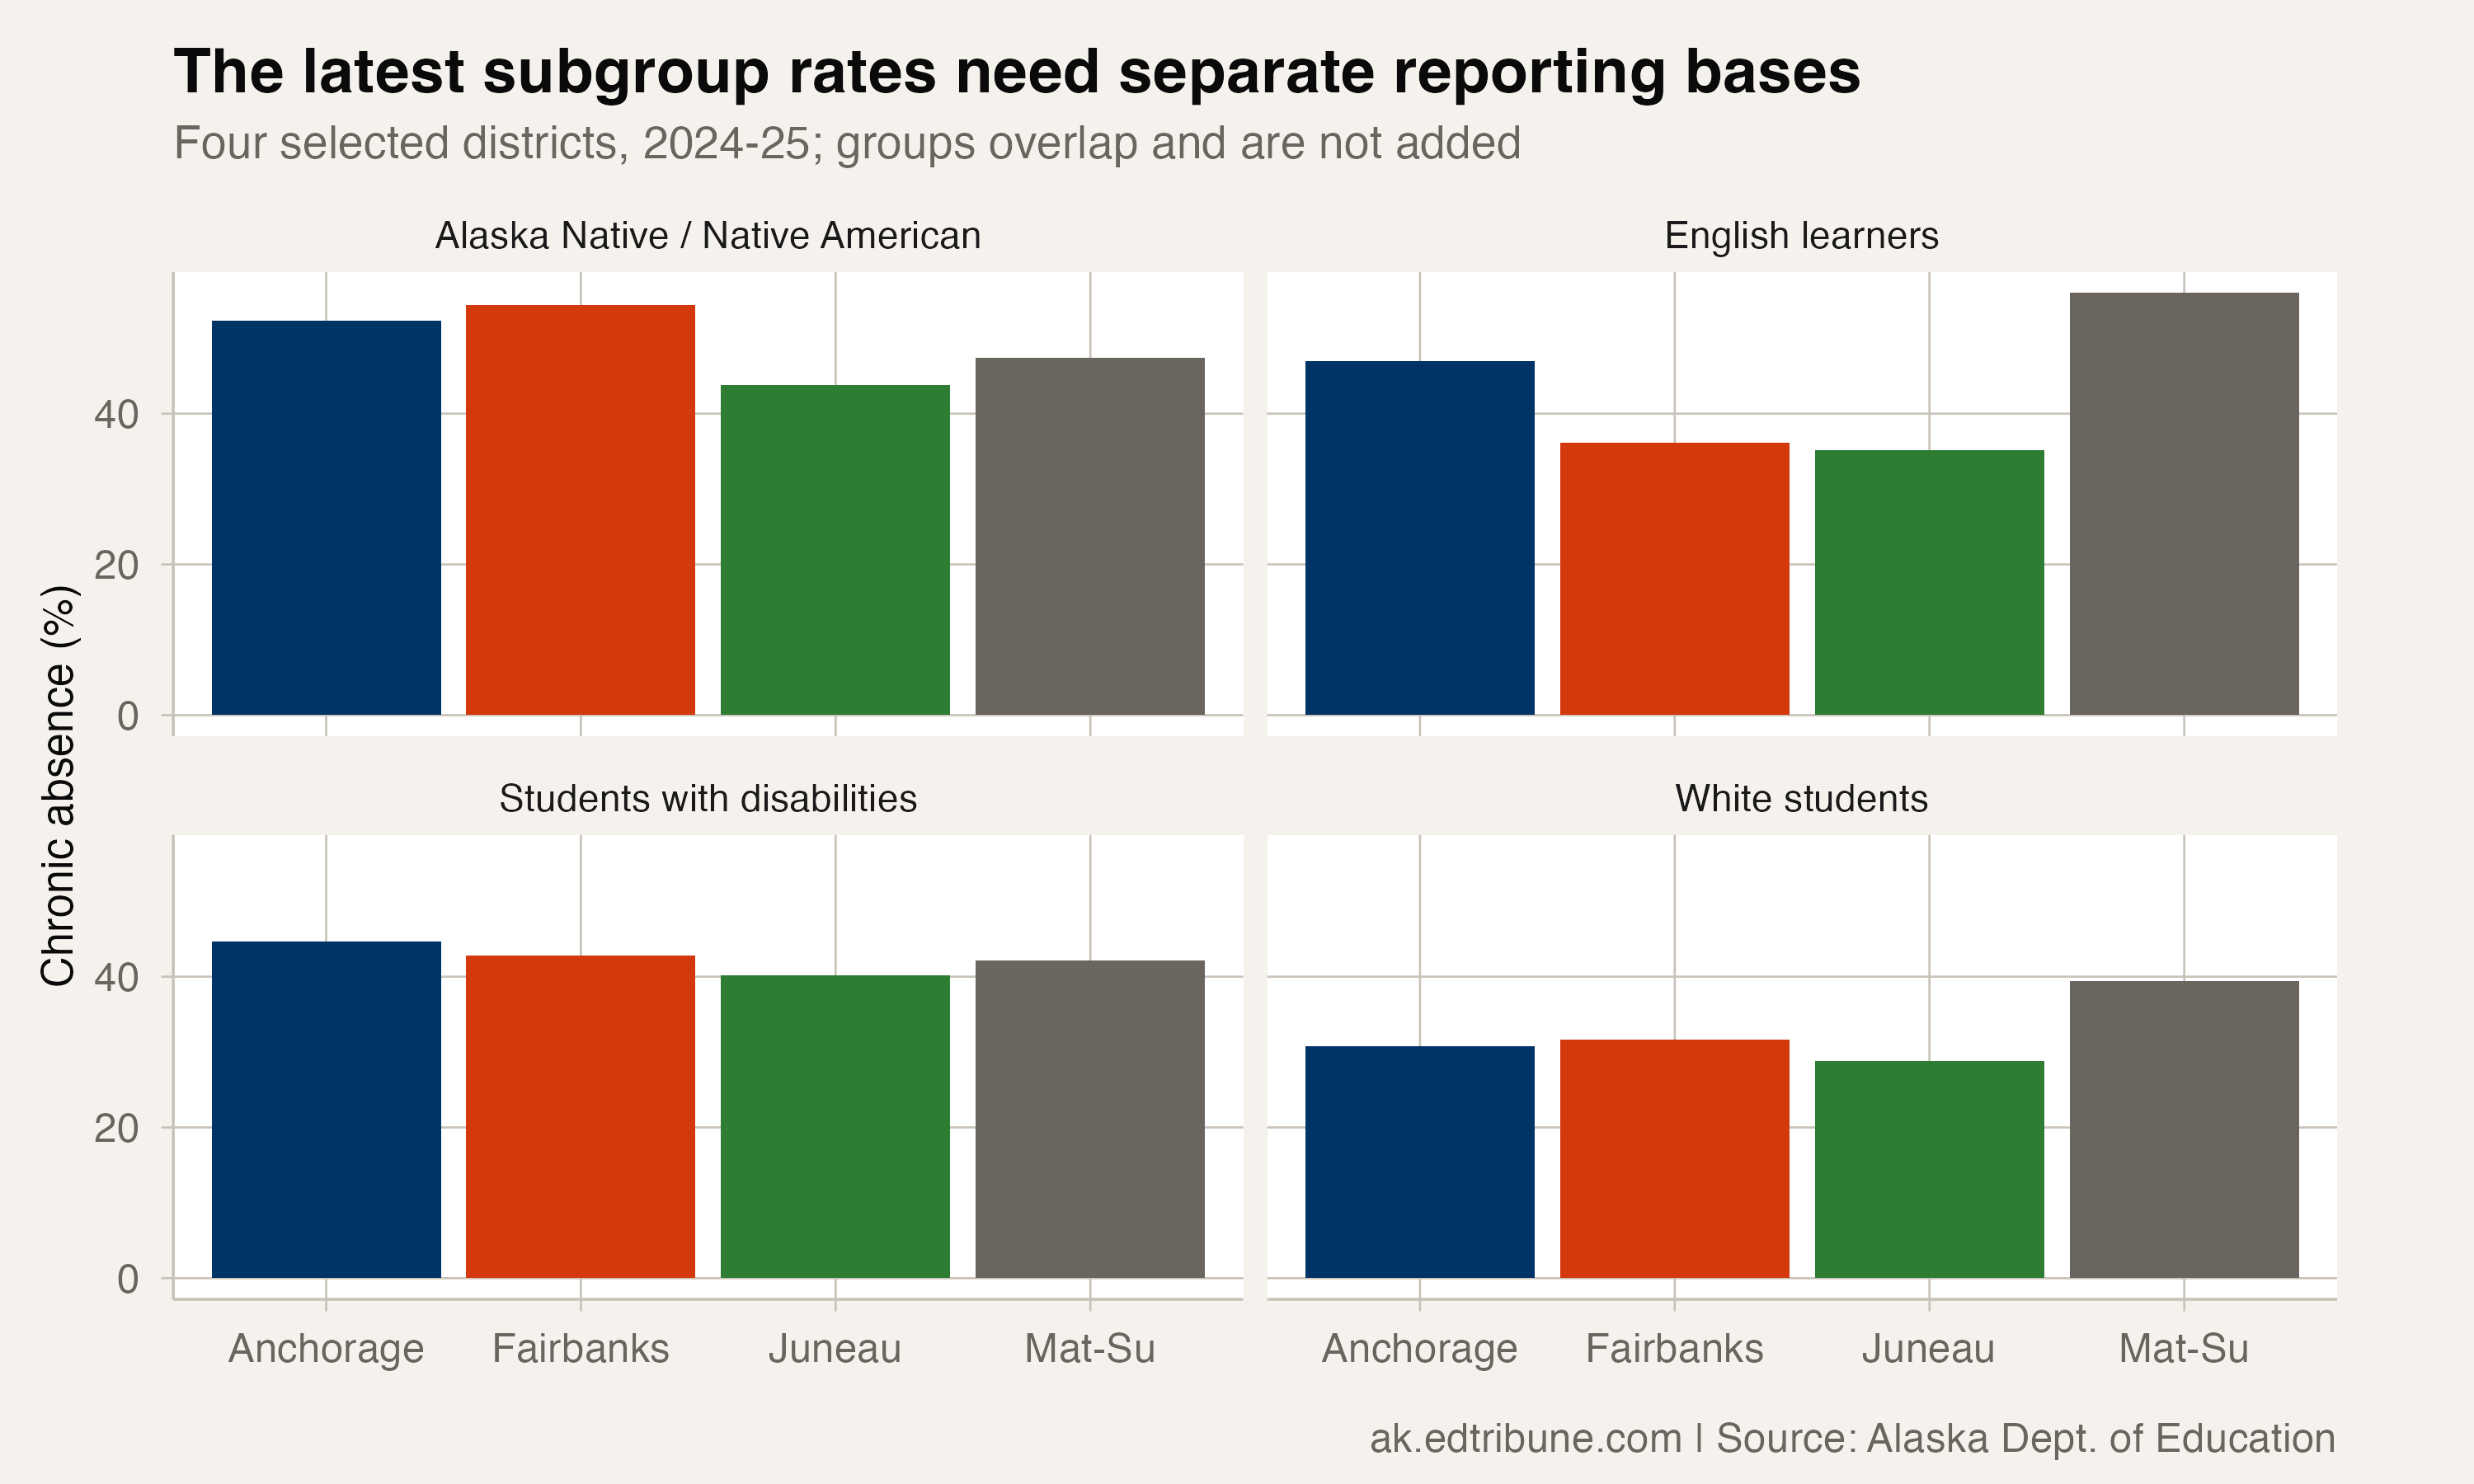
Each subgroup rate uses its own reporting population. The groups overlap with service categories and cannot be added into a district total. Their differences also do not establish that geography, leadership or a particular attendance practice explains the overall district comparison.
The Alaska Department of Education and Early Development's COMPASS reports support a specific conclusion: the selected districts' rates were below their 2021-22 levels, and two of the four posted an increase in the latest annual comparison. The record leaves the work behind those changes to further local reporting. It supports neither a universal annual recovery nor a claim that one district's approach can explain the state's results.
Detailed code that reproduces the analysis and figures in this article is available exclusively to EdTribune subscribers.
Discussion
Sign in to join the discussion.
Loading comments...