Correction: The original headline and article treated four-year and five-year rates carrying the same report year as if they followed the same students. They describe adjacent cohorts, so the reported gap cannot measure how many students from one class graduated in a fifth year. The article also misstated the four-year low, misrounded the current gap, and miscounted the subgroups whose five-year rate rose between the endpoints. The analysis, charts and text now distinguish same-report-year rate comparisons from matched-cohort graduate counts.
In 2021, Alaska reported a 78.1% four-year graduation rate and an 84.1% five-year rate. The 6.0-point difference was the largest same-report-year gap in the seven years available. The four-year series reached its actual low one year later, at 77.8% in 2022.
By 2025, the reported rates were 79.9% and 83.0%, a 3.2-point difference using the package's unrounded values. The four-year rate was the strongest since 2019, though still 0.5 point below that year's 80.4%.
The distinction between the two metrics is essential. A five-year rate reported in year Y follows the cohort whose four-year rate appeared in year Y minus one. A same-report-year difference is therefore a comparison between adjacent cohorts. To estimate the net increase in reported graduates after another year, the analysis instead matches each four-year cohort file to its five-year file in the following report year.
Two lines, one stable and one not
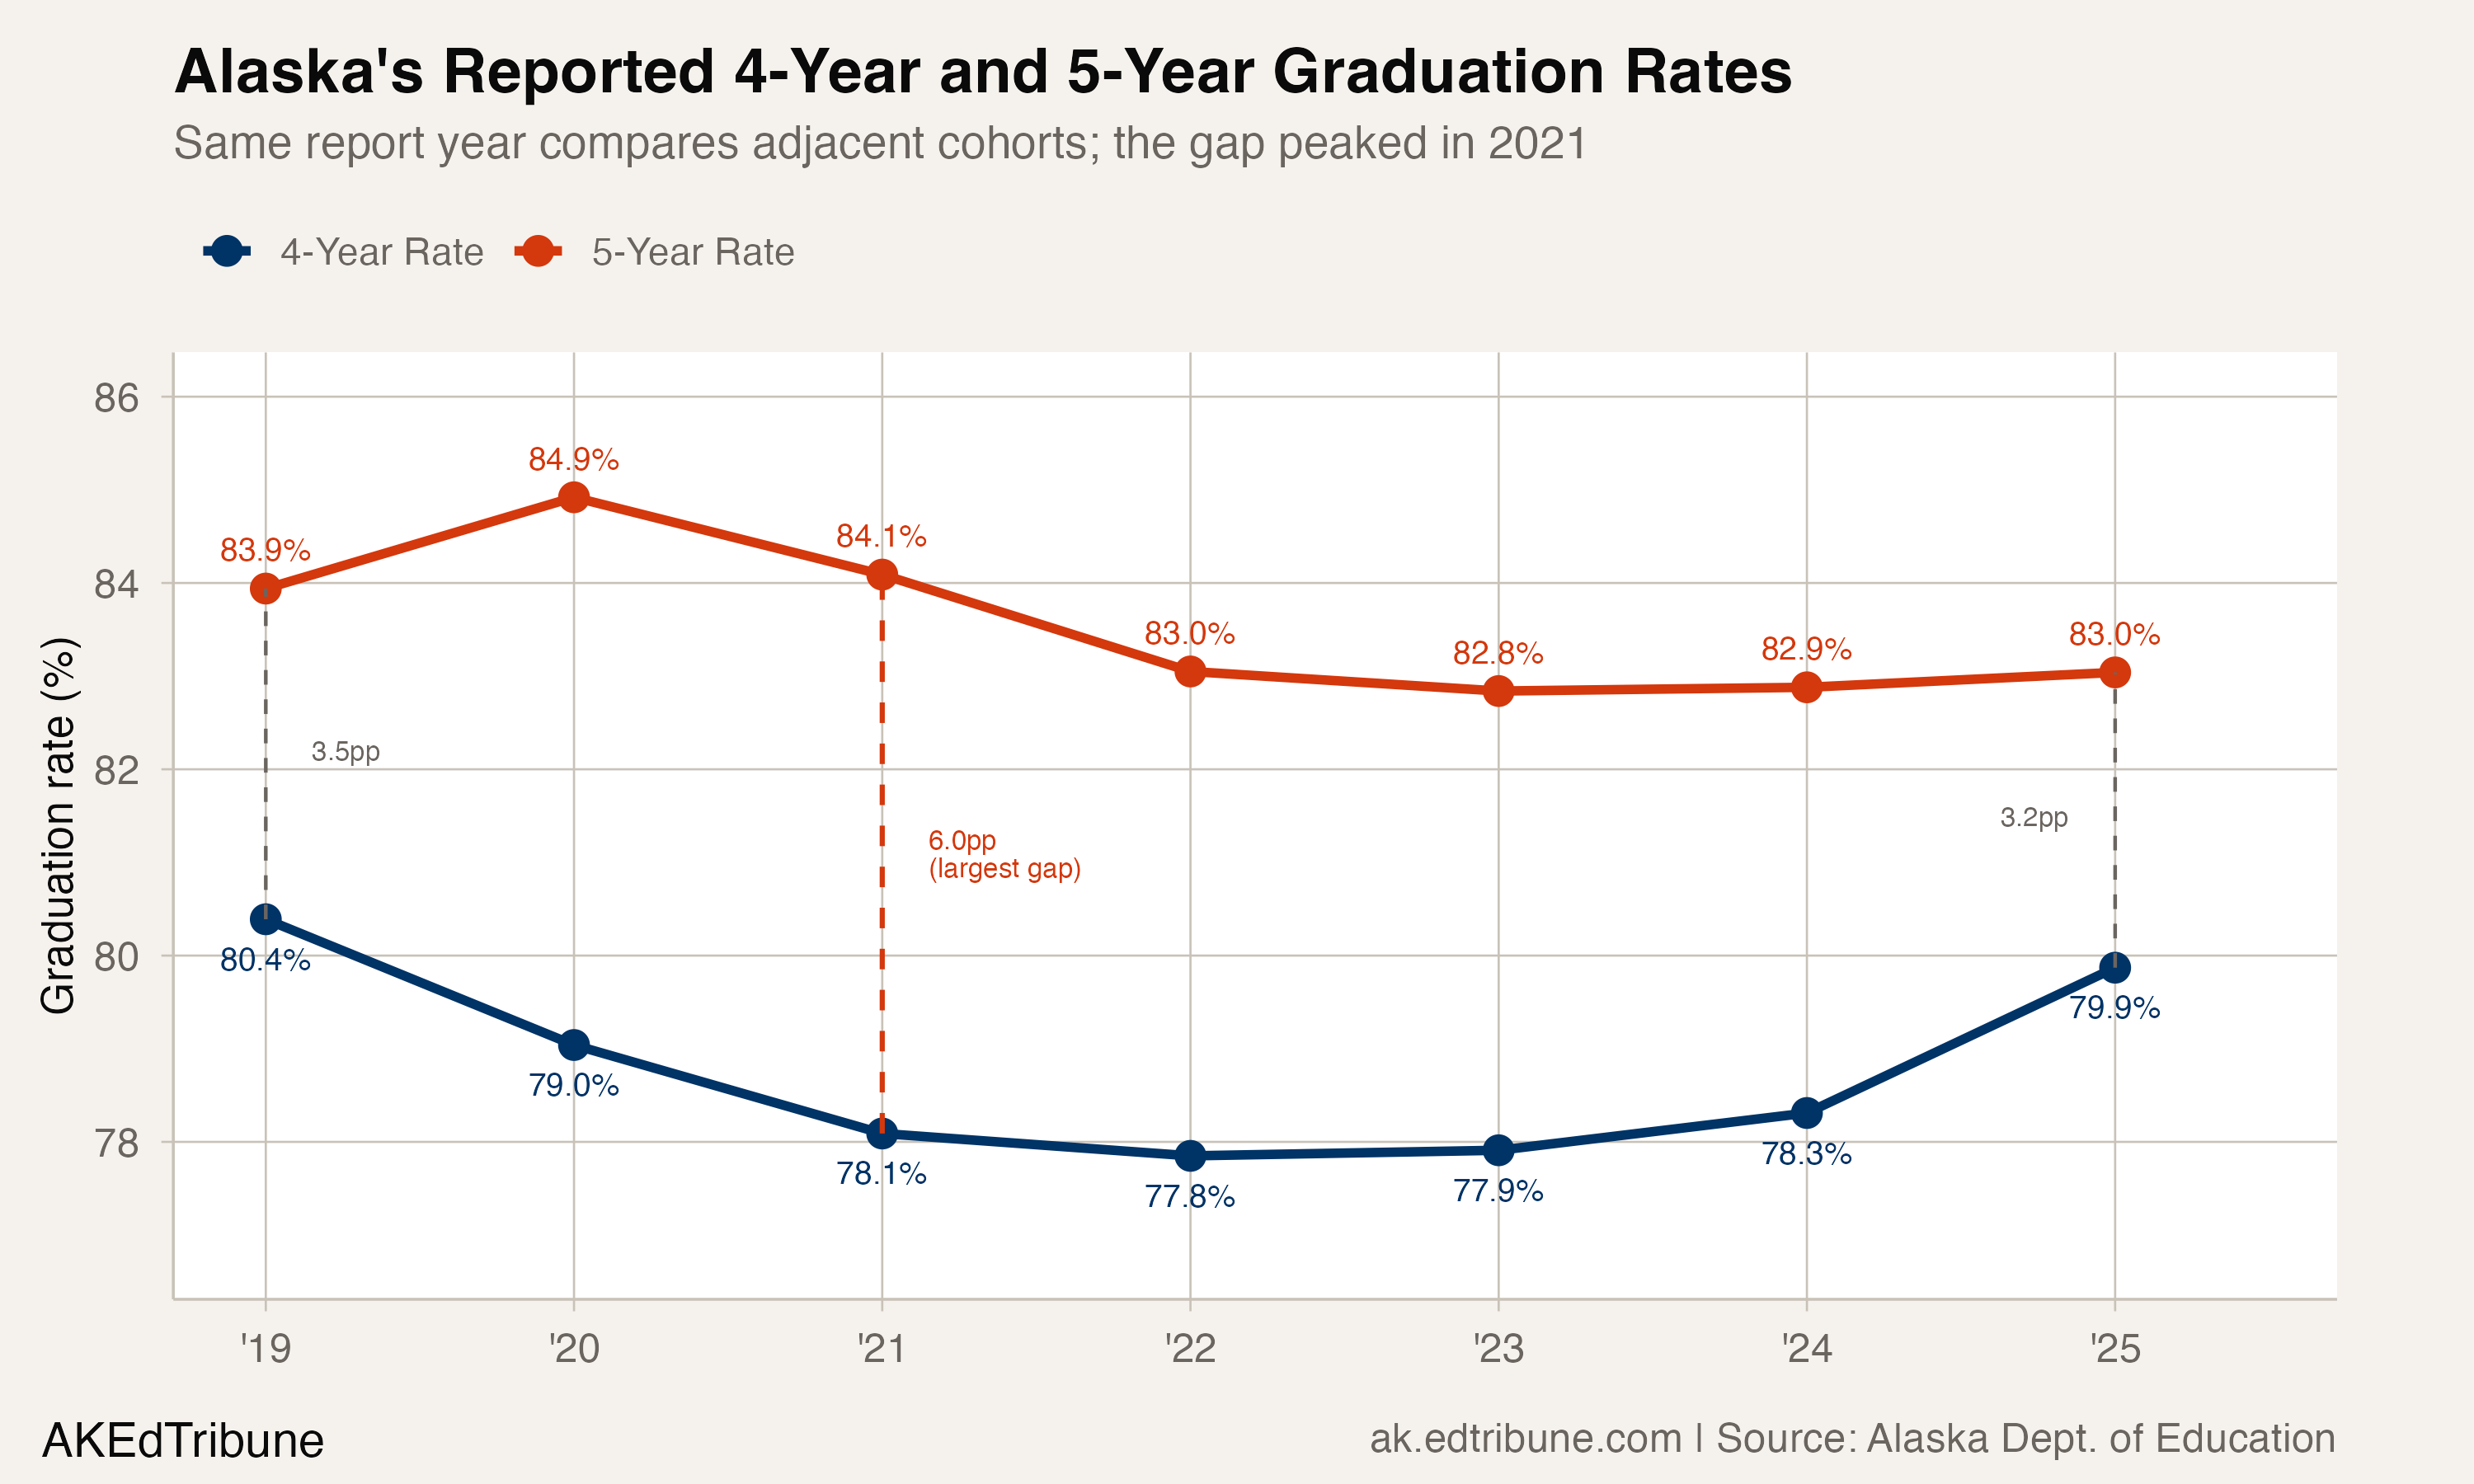
The statewide five-year rate ranged from 82.8% to 84.9%, a band of 2.1 points. The four-year rate fell from 80.4% in 2019 to 77.8% in 2022, a 2.6-point decline, before recovering to 79.9%.
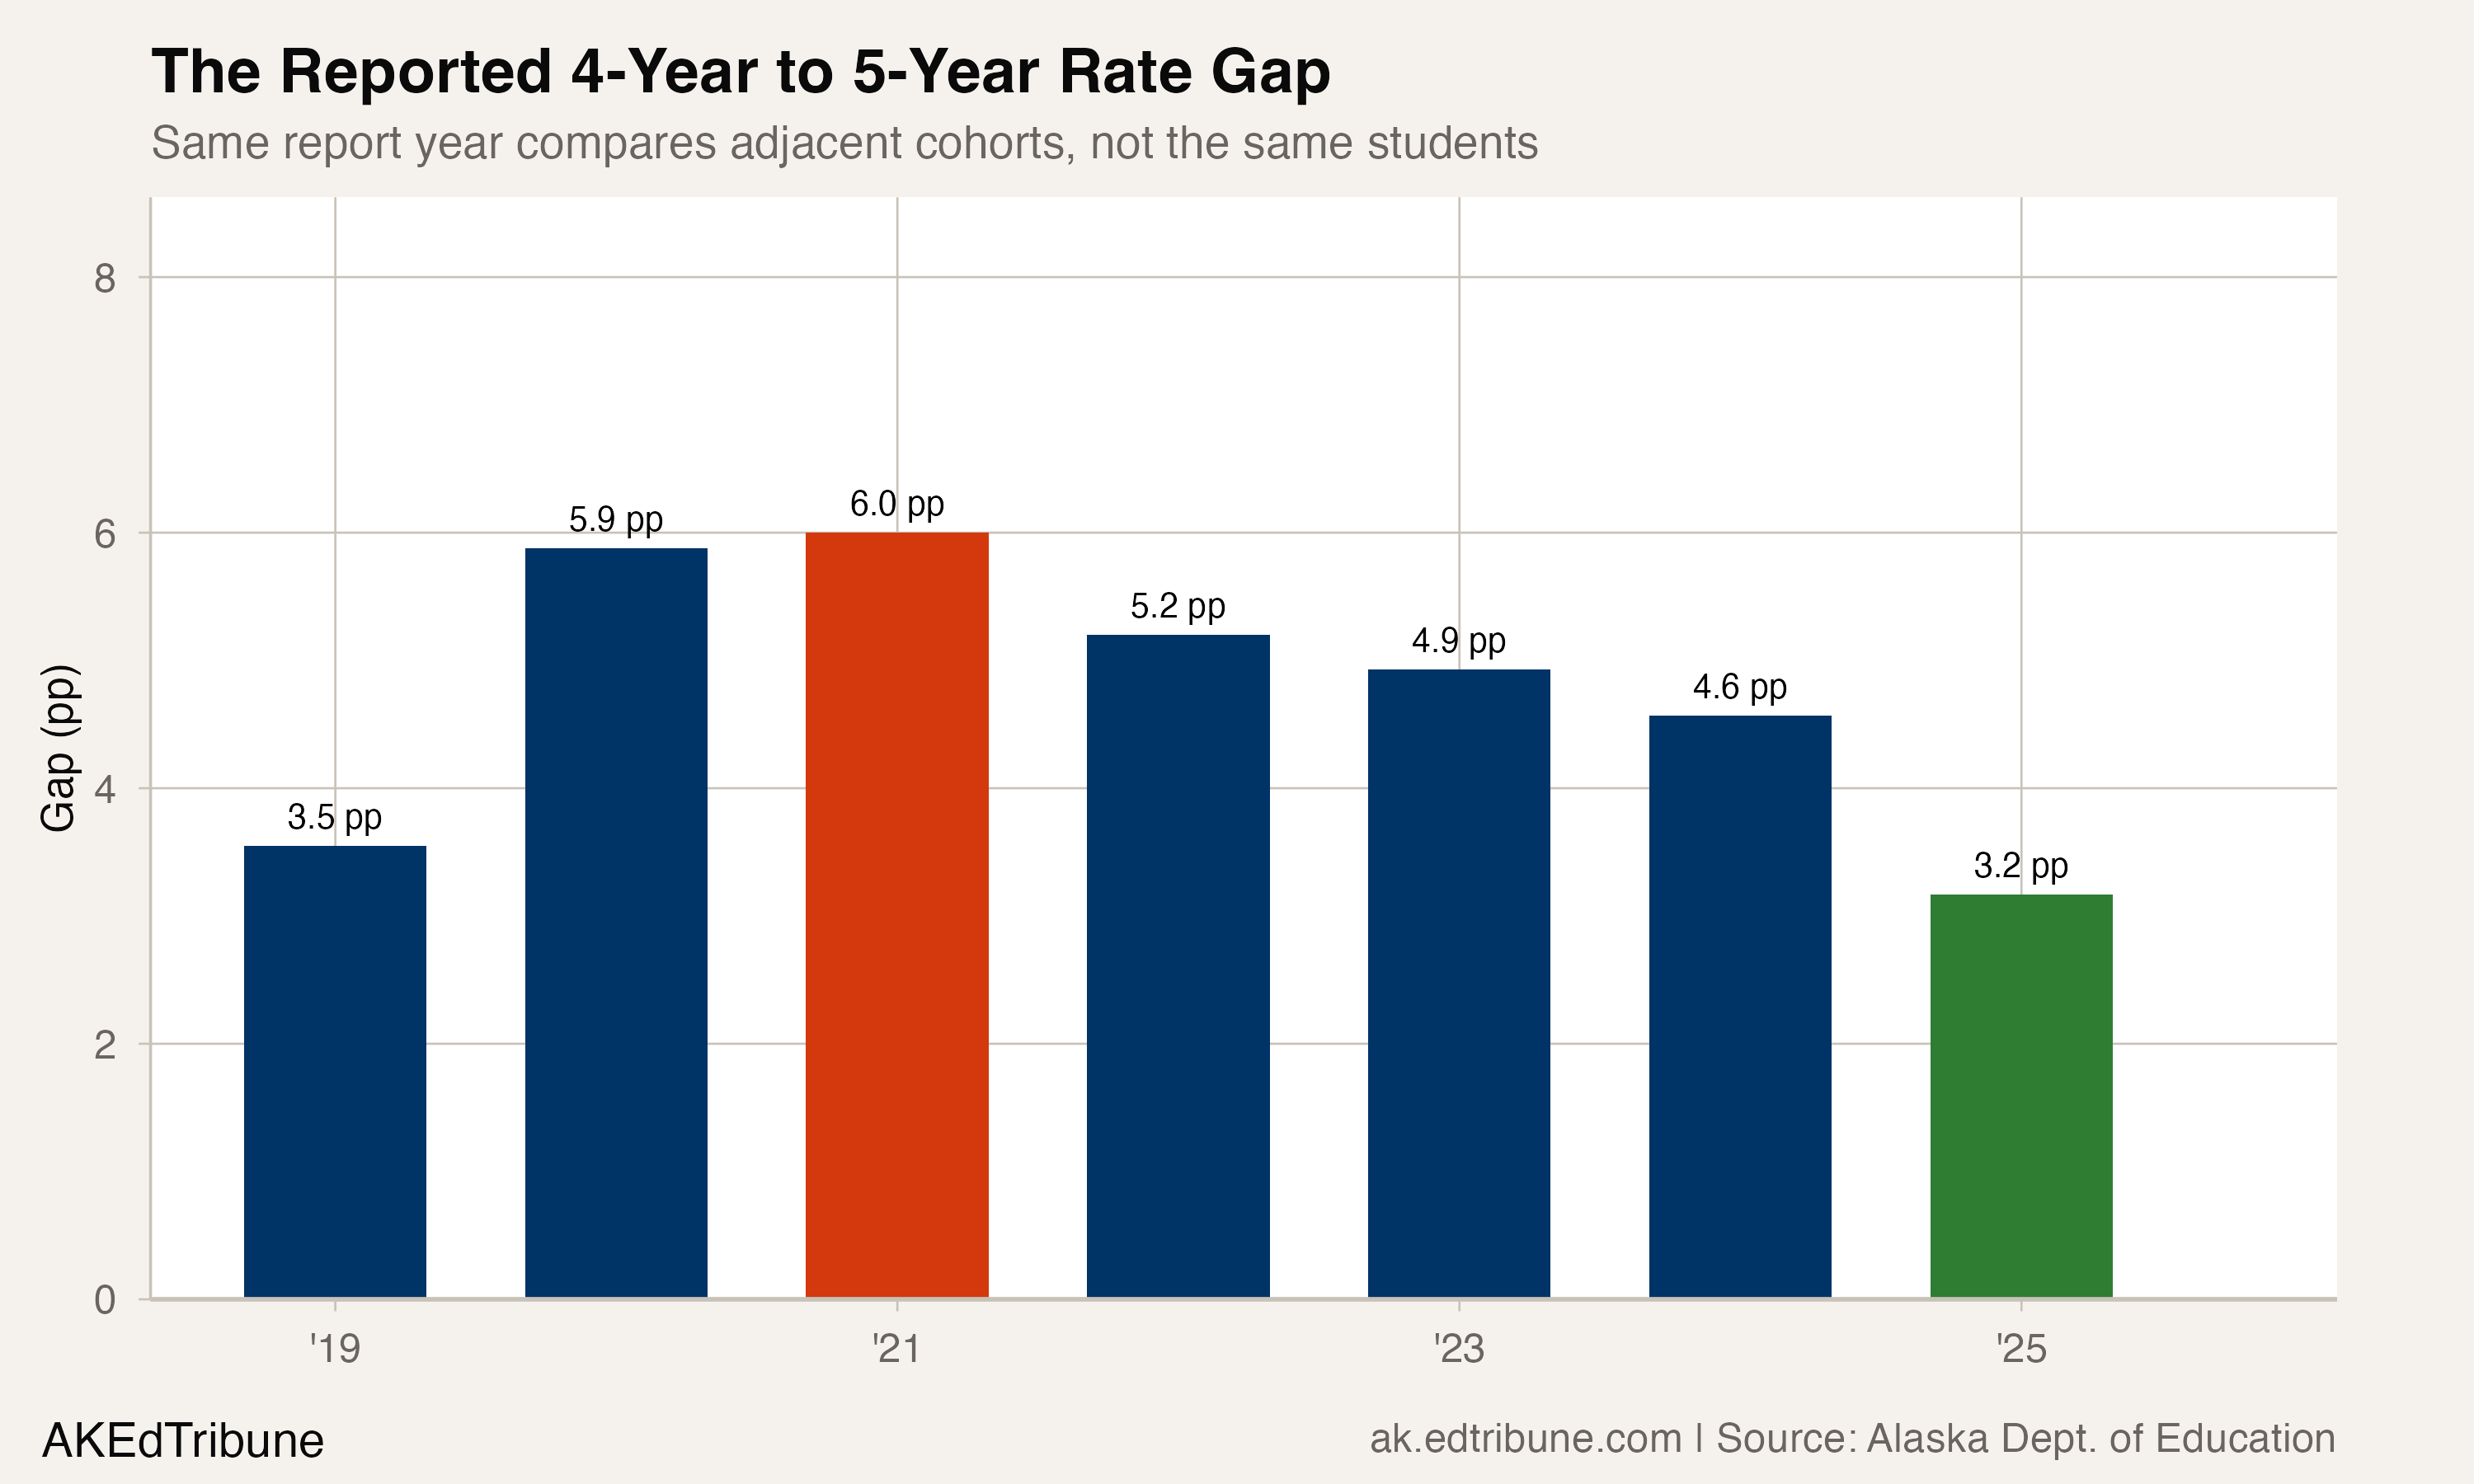
The same-report-year difference rose from 3.5 points in 2019 to 5.9 in 2020 and 6.0 in 2021. It then contracted to 5.2, 4.9, 4.6 and 3.2 points. Those differences describe the two published rate series; they do not identify individual students or explain why the series moved.
2,649 net additional reported graduates
Matching each cohort's four-year file to its following-year five-year file produces annual net increases of 406 to 473 reported graduates. Across the six matched comparisons from 2020 through 2025, the increase totals 2,649. That equals 21.0% to 22.4% of the non-graduate count in the corresponding four-year file.
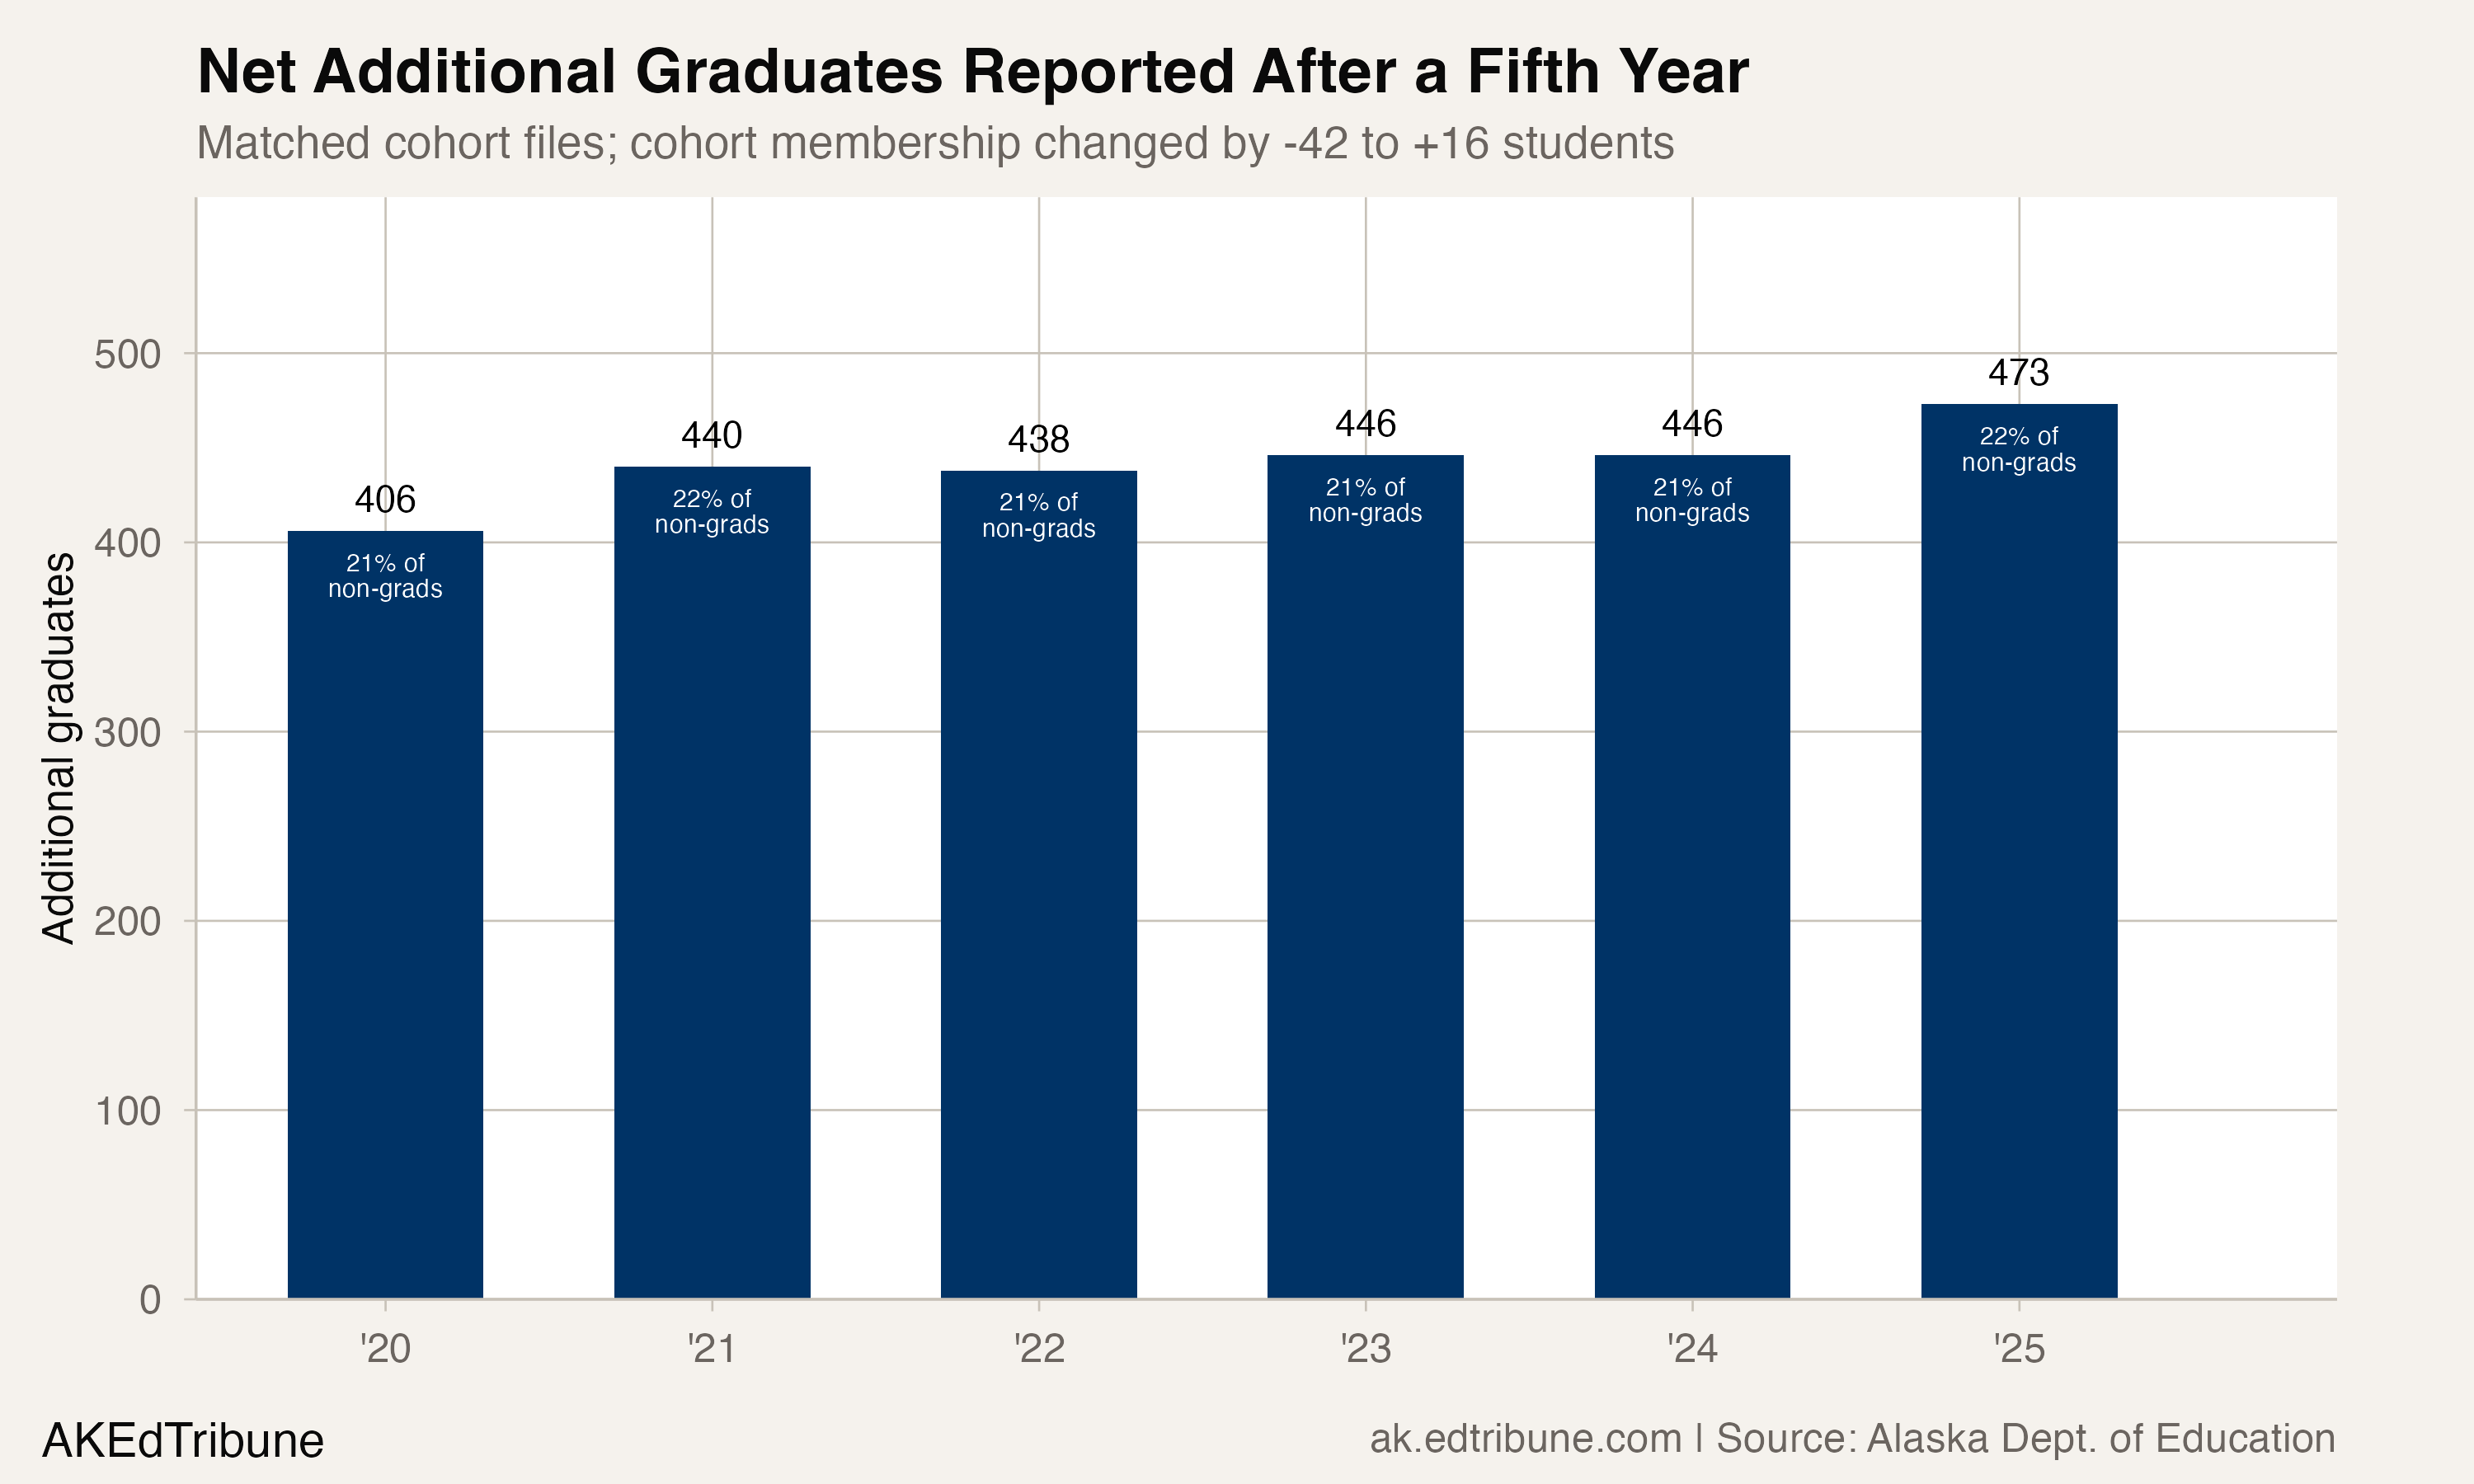
The 2025 comparison had the largest net increase, 473. But this remains a file-level measure, not a matched-student count: reported cohort membership changed between the paired files, ranging from 42 fewer students to 16 more. The data support a net graduate-count difference, not the claim that every difference represents a specifically identified late graduate.
Where reported gaps are largest
The same-report-year comparison varies by subgroup. In 2021, students who were currently homeless had an 18.5-point difference between the reported four-year rate of 50.8% and five-year rate of 69.3%. Economically disadvantaged students had a 10.0-point gap, students receiving special education services 8.8 points and Alaska Native students 8.7 points.
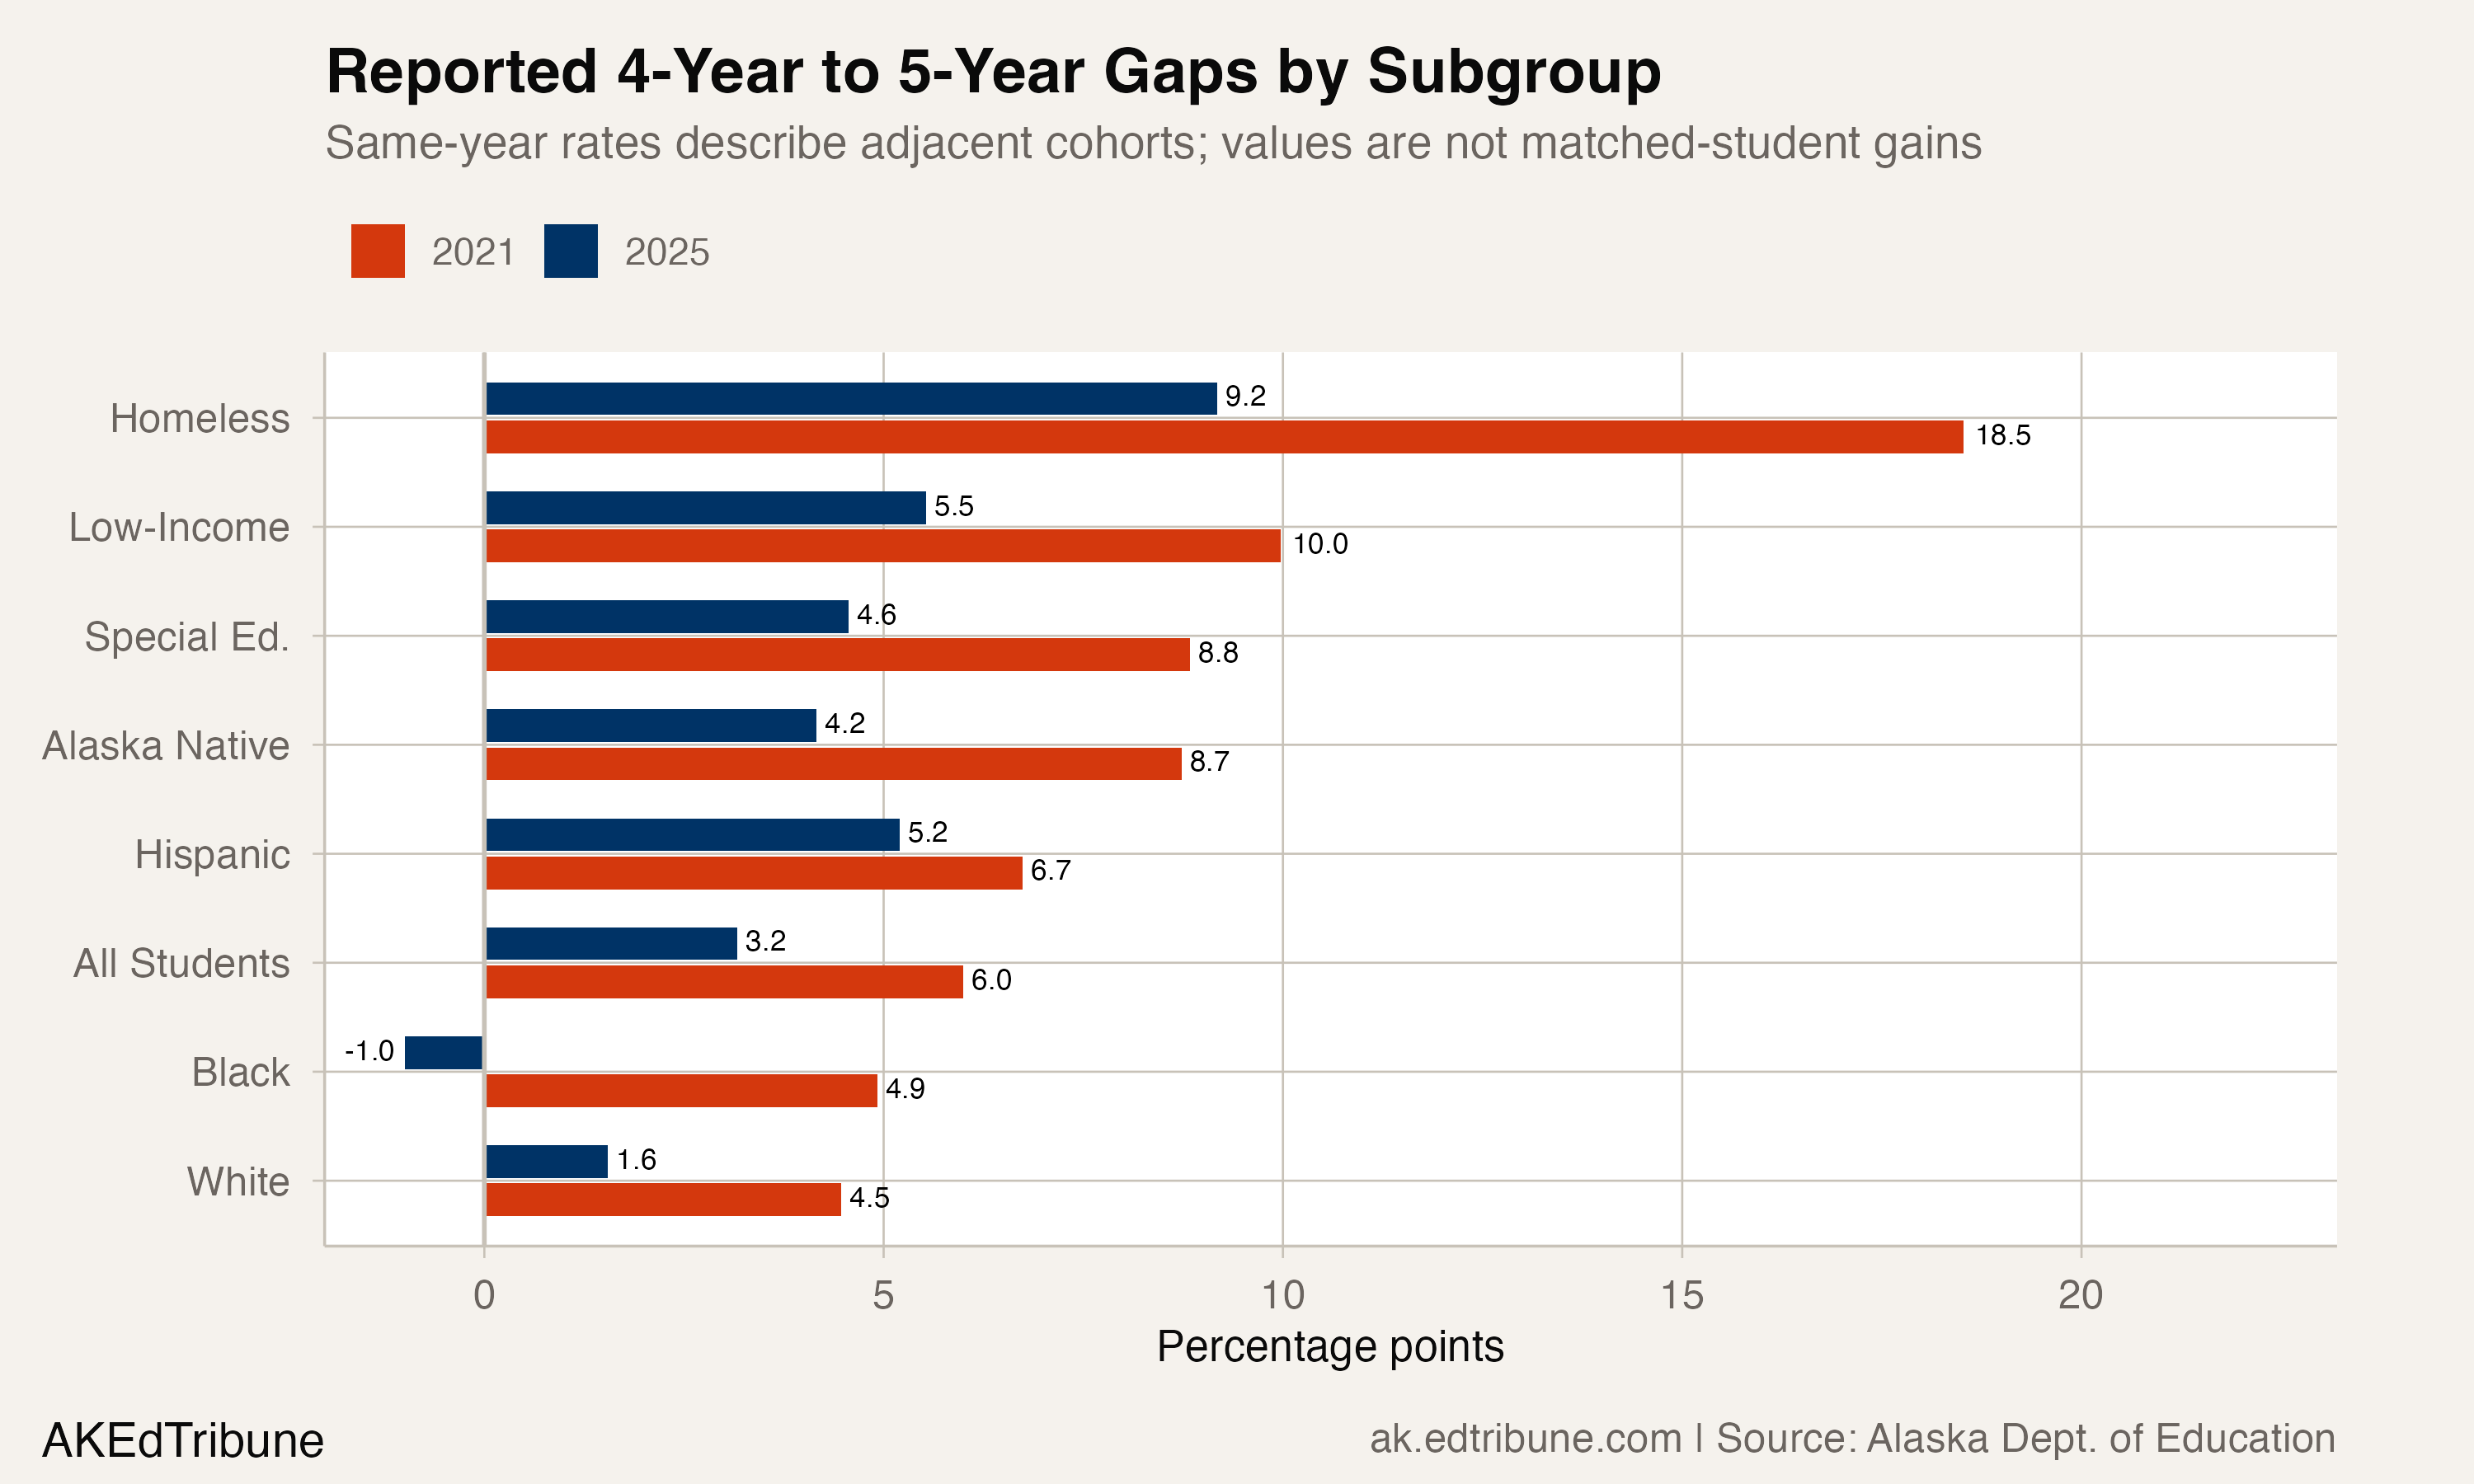
By 2025, the homeless same-report-year gap was 9.2 points, compared with 3.2 statewide. Across the two endpoints, the reported four-year rate rose from 50.8% to 63.4%, while the reported five-year rate rose from 69.3% to 72.6%. Each endpoint still compares adjacent cohorts.
For economically disadvantaged students, the reported gap narrowed from 10.0 points in 2021 to 5.5 in 2025. The four-year rate rose from 69.8% to 74.6%, and the five-year rate moved from 79.8% to 80.1%. The current package uses a different low-income label in 2019 and has no comparable economic-disadvantage rows for 2023 or 2024, so this article does not splice those records into one trend.
The Alaska Native four-year rate fell from 68.6% in 2019 to 64.5% in 2022 and recovered to 68.0% in 2025. The same-report-year gap was 7.5 points in 2019 and 4.2 in 2025; the five-year rate at those endpoints was 76.1% and 72.1%. Those figures do not establish how many individual Alaska Native students graduated late.
A district-level divergence
The five largest districts show distinct same-report-year gaps.
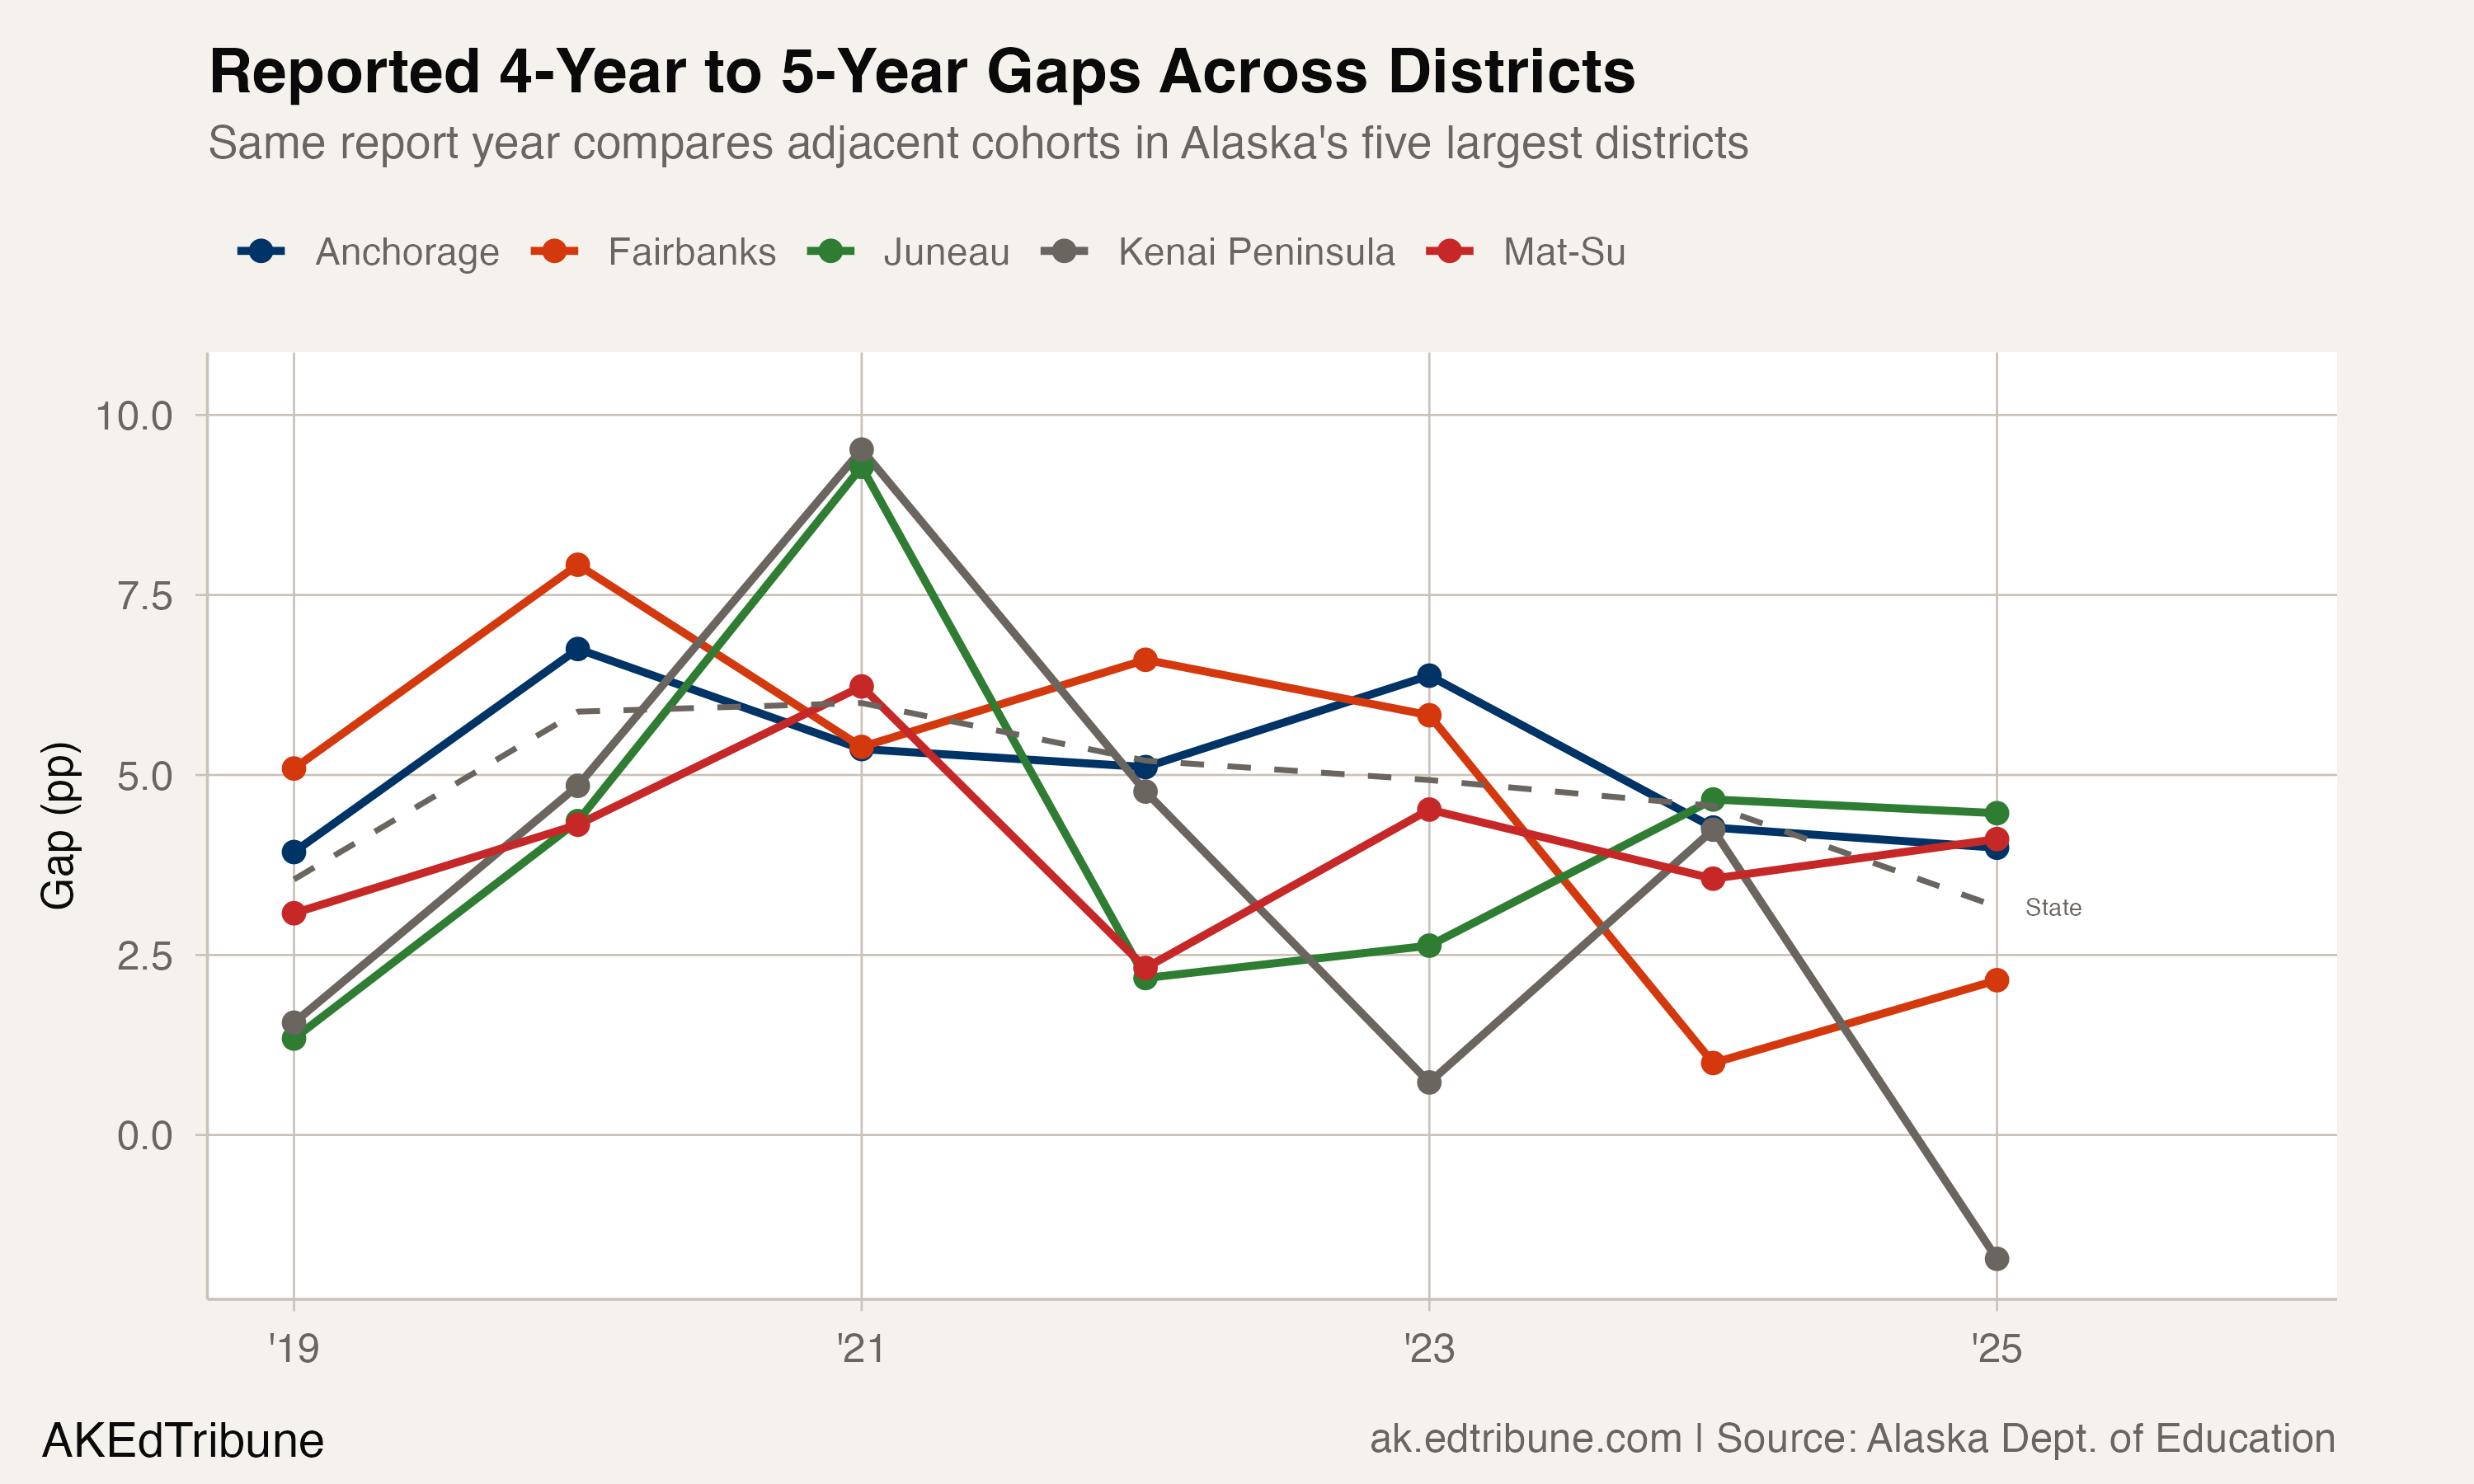
Kenai Peninsula Borough School District↗ET produced the largest 2021 same-report-year gap among the five districts, 9.5 points. Its four-year rate fell from 87.6% in 2019 to 78.6% in 2021. In 2025, the four-year rate of 85.0% exceeded the five-year rate of 83.3% by 1.7 points, the only negative gap among the five districts.
Fairbanks North Star Borough School District↗ET started the period with a gap well above the state average (5.1 points in 2019), peaked at 7.9 points in 2020, and then compressed sharply. By 2024, the gap was just 1.0 point, the tightest of any large district. In 2025 it widened slightly to 2.2 points, but the four-year rate (81.2%) is the strongest Fairbanks has posted in the available data.
Anchorage School District↗ET accounted for 31.5% of Alaska's reported 2025 four-year cohort. Its same-report-year gap ranged from 3.9 to 6.8 points and ended at 4.0 in 2025, when its four-year rate was 83.3%.
What the files do and do not show
The matched files show a consistent net increase in reported graduate counts after another year, but changing cohort membership prevents a student-level interpretation. The same-report-year gaps show differences between published four-year and five-year rate series for adjacent cohorts. Neither calculation identifies causes.
The four-year rate's recovery to 79.9% in 2025 remains 0.5 point below the 2019 baseline of 80.4%. Among Alaska Native students, the corresponding rates were 68.0% and 68.6%. Students receiving special education services moved the other direction, from 59.8% in 2019 to 61.1% in 2025.
Among subgroup labels present in both endpoint files, five reported five-year rates were higher in 2025 than in 2019: military-connected students by 3.8 points, students who were currently homeless by 2.9, Hispanic students by 2.2, multiracial students by 1.9 and English learners by 31.5. The English-learner comparison starts from a reported 40.7% in 2019, a discontinuity large enough to warrant caution. The package output supports those endpoint differences, not an explanation for them.
Detailed code that reproduces the analysis and figures in this article is available exclusively to EdTribune subscribers.
Discussion
Sign in to join the discussion.
Loading comments...